Strategy
How to measure marketing ROI when every platform claims the sale: a method for Indian startups
How to measure marketing ROI in an Indian startup when every ad platform claims the sale: contribution, fully loaded CAC and a holdout test, reviewed weekly.

· 11 min read
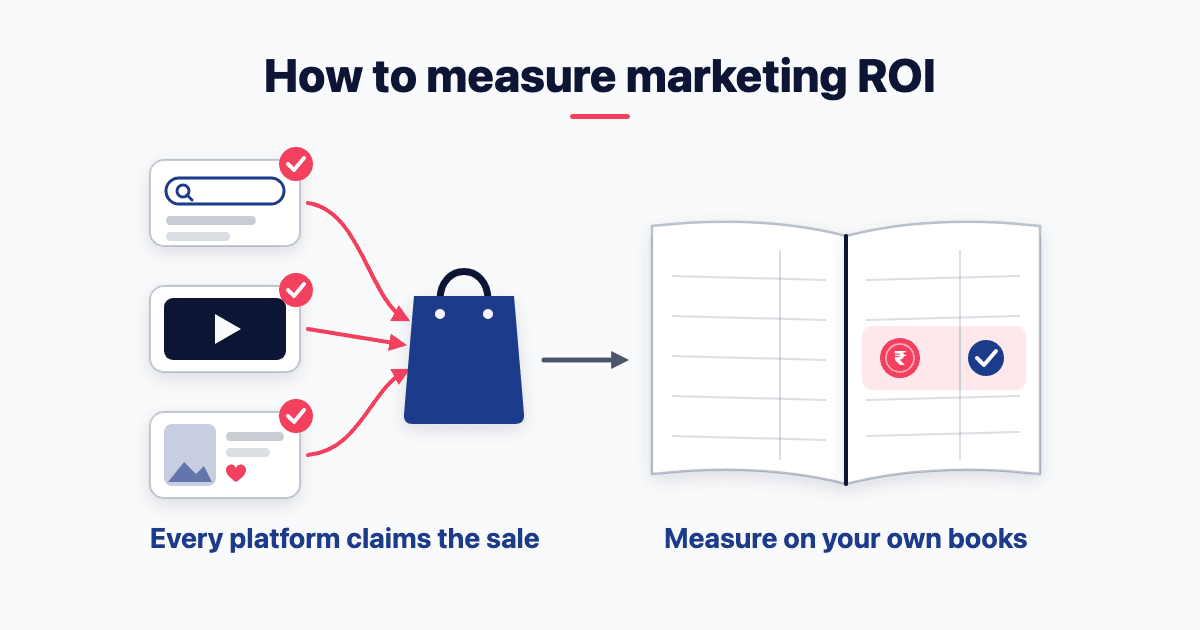
Every ad platform marks its own homework. By default, Google Ads counts a sale for up to 30 days after an ad click (Google Ads Help on conversion windows). So measure marketing ROI on your own books: the extra contribution marketing caused, minus everything it cost, divided by that cost. Written for Indian startups, the method works anywhere.
Four habits get you there: count contribution, load every cost, test what would have sold anyway, and review it weekly.
What is the marketing ROI formula, and how is ROI different from ROAS?
Marketing ROI (return on investment) = (incremental contribution − marketing cost) ÷ marketing cost. Incremental means only the contribution your marketing caused, not everything that came in while the ads ran. Cost means every rupee, fully loaded.
Contribution is revenue after product cost, shipping, payment fees and returns, before marketing. My D2C guide works out one order's contribution, cash on delivery included.
Return on ad spend (ROAS) is a different number. Google's target ROAS is "the average conversion value (for example, revenue) you'd like to get for each dollar you spend on ads" (Google Ads Help on Target ROAS). So ROAS is revenue, from one platform's ads, by that platform's own count.
Three numbers, three jobs:
Platform ROAS: to choose ads and keywords inside one platform.
The business ratio: revenue ÷ total marketing cost, to watch the trend.
Incremental ROI: from a holdout, to move budget between channels.
The bridge is breakeven ROAS: 1 ÷ contribution margin. An illustrative example: a ₹1,000 order leaves ₹400 of contribution, a 40% margin, so breakeven is 2.5×.
The platform reports 4× on ₹1 lakh of spend. That's ₹4 lakh of revenue and ₹1.6 lakh of contribution: a 60% return on the media. Then a holdout shows half those sales would have happened anyway. Incremental revenue is ₹2 lakh, contribution ₹80,000, and ROI −20%.
Same campaign, same dashboard. One number says scale it; the other says it loses money.
One India check: if your pixel's order values include goods and services tax (GST), every platform's ROAS counts tax you pass on to the government.
A rising ROAS and a growing business are two different claims. ROAS can rise while sales fall, if spend falls faster.
Why does every platform claim the same sale?
Because each ad platform counts the sales that followed its own ads, by its own rules. Two of Google's own tools show how.
Google Ads dates the sale back. "Google Ads reports conversions on the ad impression date. Other reporting tools attribute them to the conversion date" (Google Ads Help on data discrepancies).
Google Analytics 4 (GA4) can hand Google Ads all the credit. Its "Google paid channels last click" model "Attributes 100% of the key event value to the last Google Ads channel" clicked (Google Analytics Help).
So Google's own two tools disagree by design, and every other platform has its own attribution setting.
Then run the claims check. Add up one week's purchases as each platform reports them. Divide by the orders in your own system, such as Shopify or your payment gateway. Above 1 shows the platforms are claiming more orders than you received. Below 1 proves nothing, because your total includes organic and direct buyers.
One India twist: if your purchase event fires at checkout, a cash-on-delivery order refused at the door still sits in the platform's ROAS.
How do you calculate fully loaded customer acquisition cost (CAC)?
Take every rupee spent winning new customers, and divide by the new customers your own system counted:
CAC = (media + GST you can't claim back + agency or freelancer fees + marketing's share of salaries + tools + creative) ÷ new customers in the same period.
Count first-order discounts exactly once, either in contribution or in CAC. Don't count them twice, and don't leave them out.
Don't skip GST. If you buy from Google India, you pay GST "on all the purchases you make" (Google Ads Help on taxes in India). The rate is 18%, split into 9% central and 9% state GST if your bill-to address is in Haryana. Advertisers in a Special Economic Zone pay 0%. Count only what you can't reclaim as input tax credit. Ask your chartered accountant; this isn't tax advice.
Report paid CAC beside blended CAC (all spend ÷ all new customers). Blended improves as organic grows, while paid can quietly worsen.
If you sell through leads, your CAC is cost per closure: what each closed customer cost. My IIT Kanpur Session 7 sheet re-prices a lead funnel this way, and tells founders who sell through carts that it's their CAC too.
Then compare it with your payback ceiling; my budget guide also covers GST and tax deducted at source.
Incrementality testing: how do you prove the sale wouldn't have happened anyway?
Hold some people or places back from your ads, then compare. That's incrementality testing. The Interactive Advertising Bureau and Media Rating Council's retail media guidelines (January 2024) define it: incrementality "is the potential causal impact of marketing".
My Session 7 pre-read puts it more bluntly, about a drip campaign: its control group "is the only proof you will ever have". Ads need the same proof. Three designs, strongest first.
Design 1: a platform's own lift study
Google's user-based Conversion Lift needs "at least 1,000 observed conversions" and "a minimum campaign budget of $5,000 USD". The same page warns: "Conversion Lift isn't available for all Google Ads accounts" (Google Ads Help on user-based lift).
The geography-based version "typically requires a higher budget than the user-based alternative" (Google Ads Help on geo lift data).
Results come as ranges. Google's example reads an incremental return on ad spend (iROAS) of 2.2, in a range "from at least 1.3 to at most 3.5". At a 40% margin, that range straddles your 2.5× breakeven. The platform still grades its own campaigns, but against a real control group.
Design 2: your own geo holdout
Switch ads off in comparable regions, then compare total orders in your own system. Run it until the switched-off regions have about 30 orders. My Session 5 sheet of 27 September 2026 sets that minimum for a retargeting holdout; use the same minimum here.
Months to run ≈ 30 ÷ those regions' usual monthly orders. The course's example brand, a composite rather than a real company, takes about 185 orders a month. Switch off regions carrying 20% of them, about 37 a month, and 30 orders take under four weeks. Allow longer if switching ads off cuts their sales.
Design 3: a pause test, for brand search and retargeting
Switch the campaign off long enough for 40–50 orders to land, then count rupees saved against orders lost. Rupees saved ÷ orders lost is the campaign's real CAC. Compare it with your prospecting CAC: what a new customer costs you from ads aimed at new people. Far above that, the campaign was claiming. At or below it, the sales were real.
The same sheet's illustrative numbers: ₹7,000 saved for under 10 orders lost works out to over ₹700 an order, so "it was claiming". Lose 22 or more, and its real CAC is about ₹320 or less, the example brand's prospecting CAC: "it was real".
For platform-specific designs, see the city holdout and pause test for quick-commerce ads and a fair first test of ChatGPT Ads.
Weakest of all is before and after. If it crosses Diwali or a sale, compare with the same stretch around last year's festival or sale, as my 90-day plan guide explains.
How to read the result
My Session 7 rule: "Under ~30 per arm, say 'directional' and keep the control running." The sheet adds: never call a result "significant" unless both arms have 30 or more conversions.
For retargeting, I teach my IIT Kanpur cohort that "platform ROAS 8–10× usually means 1.5–3× real". It's a rule of thumb, not a study; your holdout gives your real number.
Read Google's label carefully, too. "Significant positive iROAS" means "net new revenue generated during the experiment is greater than the amount of money spent on the campaigns". That's revenue: at a 40% margin, you need incremental ROAS above 2.5.
Why run a test if the dashboard already shows a 6× ROAS?
Because the dashboard shows what the platform saw. A holdout shows what it caused.
Keep platform ROAS for choices inside one platform: which ad, which keyword. Use contribution and holdouts for choices between channels, and for the budget.
The question has a fair point for small accounts: they can't reach ~30 conversions per arm quickly. Then run longer, use a pause test, or accept a directional read and keep a small control running.
I'd still rather trust an underpowered test than a number from the seller of the ads. And before product-market fit, what marketing should do at your stage matters more than a precise ROI.
What should your weekly marketing ROI review cover?
Twenty minutes on Monday, one page, five lines:
New customers and fully loaded CAC, from your own system, per business line.
Contribution after marketing, against the same stretch last year.
The claims check: platform-reported purchases ÷ your own orders.
Holdout status: is the control untouched, and how close is each arm to ~30 conversions?
One decision, dated: keep, cut or test.
Line 5 is what turns a report into a decision. OurBus, the US intercity coach operator I advise, started with the opposite: "Reporting that described what happened, not what to do about it."
Don't judge last week on Google Ads alone. It "reports conversions on the ad impression date", and "Conversions can be reported up to 90 days after the click" (Google Ads Help on data discrepancies). Last week's numbers will keep moving.
Two more rules from my Session 7 sheet: "Under 15 conversions a group is 'collect more', never 'act'." And "Never say 'materially' — show rupees."
Then say one sentence: "the direction, the rupees, the caveat, and 'the control keeps running'". An illustrative one: "Retargeting looks like it's claiming: the held-out group bought almost as much, so ₹7,000 every 10–14 days may be buying little. Directional at 24 conversions per arm; the control keeps running."
Once a quarter, ask the bigger question: did the business grow faster than its spend? OurBus's case study compares June 2026 with June 2025. Year on year, return on ad spend rose from 18.7× to 21.0×, spend went up 30.8% and revenue 46.9%. The growth figures are the ones I'd show a board. (The client supplied these as multiples and ratios, and withheld absolute revenue.)
Name the milestone that shows a business line pays for its own marketing. OurBus Charters hires out coaches to groups and companies, and shares an ad account with OurBus's scheduled coach business. For Charters, it was one state: contribution after ad spend, which turned positive in Q3 2026 (margin shown as a state, not an amount).
AI tools go in the cost line too; whether AI tools pay back is its own question.
If nobody on your team has room for this review, a fractional CMO can own it.
What to do this month: your marketing ROI checklist
Pull the last four weeks of new customers and orders from your own system.
Work out contribution per order and your breakeven ROAS (1 ÷ margin).
Compute fully loaded CAC per business line, or cost per closure if you sell through leads.
Run the claims check for one week.
Start one holdout or pause test. Size a holdout to ~30 conversions in the held-out group, and a pause test to 40–50 orders while the campaign is off. Brand search or retargeting is easiest.
Hold the first Monday review, and write the one sentence.
If you'd like to go through last quarter's numbers together, book a call and we'll look at what your marketing actually added.
Frequently asked questions
What is a good marketing ROI?
Any ROI above zero, measured on incremental contribution after fully loaded cost, means marketing paid for itself. A channel's floor is breakeven ROAS: 1 ÷ contribution margin, or 2.5× at a 40% margin. Be wary of the widely quoted 5:1. One CRM vendor's India guide calls it "often considered very good", yet computes ROI from "sales revenue".
How long before marketing ROI shows?
Give it at least one full buying cycle. Google Ads' default conversion window is 30 days. LinkedIn's 2019 survey covered 4,000 marketers across 19 countries, India among them. As reported by afaqs, "78 per cent of Indian marketers" measured within 30 days, against sales cycles of "60-90 days or longer". The Indian sample size isn't stated.
What's the difference between incrementality testing and A/B testing?
An A/B test shows people two versions of an ad or page and asks which works better. An incrementality test holds a group back from your ads altogether. As Google's Conversion Lift page puts it, "the difference in conversions between these 2 groups" is the lift: the sales your ads caused.
Do you need marketing mix modelling?
Usually not at startup scale. Google's open-source model, Meridian, suggests "a minimum of two years' worth of weekly data for geo-level models and three years' of data for national-level models" (Meridian's data guide). Until you have that history across several channels, holdouts are cheaper and give clearer answers.
How do you calculate marketing ROI in Excel?
Use one row per month. Add columns for new customers from your own system, revenue, contribution before marketing, fully loaded marketing cost, and the incremental share from your latest holdout. Then ROI = (contribution × incremental share − cost) ÷ cost. Add a breakeven ROAS column, 1 ÷ margin, and flag any channel below it.
- Measurement
- Founders
- Marketing ROI
Written by Siddhesh Joglekar
Fractional CMO and AI marketing consultant Siddhesh Joglekar helps founders and growth-stage teams build marketing engines that compound.